Surfer produces spectacular 3D rendered surface maps with complete control over lighting and shading, position, rotation and tilt angles.
Overlay raster and vector base maps, contour maps, image maps, shaded relief maps, post maps and vector maps and specify the color modulation (surface and overlay blending).
Contour Maps
Surfer contour maps give you full control over all map parameters. You can accept the Surfer intelligent defaults to automatically create a contour map, or double-click a map to easily customise map features. Display contour maps over any contour range and contour interval, or specify only the contour levels you want to display on the map. And with Surfer you can add colour fill between contours to produce dazzling displays of your maps, or produce gray scale fills for dramatic black and white printouts.
Vector Maps
Instantly create vector maps in Surfer to show direction and magnitude of data at points on a map. You can create vector maps from information in one grid or two separate grids. The two components of the vector map, direction and magnitude, are automatically generated from a single grid by computing the gradient of the represented surface. At any given grid node, the direction of the arrow points in the direction of the steepest descent. The magnitude of the arrow changes depending on the steepness of the descent.
Two-grid vector maps use two separate grid files to determine the vector direction and magnitude. The grids can contain Cartesian or polar data. With Cartesian data, one grid consists of X component data and the other grid consists of Y component data. With polar data, one grid consists of angle information and the other grid contains length information. Overlay vector maps on contour or wireframe maps to enhance the presentation!
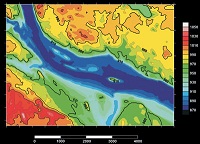
Image Maps
Surfer image maps use different colours to represent elevations of a grid file. Create image maps using any grid file format: GRD, DEM, SDTS DDF, GTOP30 HDR. Surfer automatically blends colours between percentage values so you end up with a smooth colour gradation over the map. You can add colour anchors at any percentage point between 0 and 100.
Each anchor point can be assigned a unique colour, and the colours are automatically blended between adjacent anchor points. This allows you to create colour maps using any combination of colours. Any colour fill you choose for an image map can be used with any other image map, even if the associated grid files cover distinctly different Z ranges. Image maps can be created independently of other maps, or can be combined with other maps. They can be scaled, resized, limited and moved.
Shaded Relief Maps
Surfer Shaded Relief maps create a shaded relief map from a grid [.GRD] file or USGS DEM file. These maps use different colours to indicate surface slope and slope direction relative to a user-defined light source direction. Surfer determines the orientation of each grid cell on the surface, and assigns a unique colour to each grid cell. Colours on shaded relief maps are associated with light striking the surface. The light source can be thought of as the sun shining on a topographic surface.
Surfer automatically blends colours between percentage values so you end up with a smooth colour gradation over the map. You can add colour anchors so each anchor point can be assigned a unique colour, and the colours are automatically blended between adjacent anchor points. This allows you to create colour maps using any combination of colours. Shaded relief maps can be created independently of other maps, or can be combined with other maps in map overlays (using the Overlay Maps command). Shaded Relief maps can be scaled, resized, limited, and moved in the same way as other types of maps.
New in version 24
-
Base layers: convert coordinates of vector base layers
-
Disperse Labels: added for drillhole, base and post layers
-
Grid Editor: display base, post and classed post layers for context
-
Label Leader Lines: added for drillhole and base layers
-
Profile: XY Axis: automatically adjust Scaling and Limits when profile layers are turned off/on
-
Many more!