Grapher 11 Released
23/07/2014
Complex Graphing Made Easy!
Top Grapher 11 new features are new plot types (ternary class, doughnut, 3D doughnut, polar vector), Linked axes, Improved error bars, Enhanced class plots, Plus many more...
Grapher is the ultimate technical graphing package available. This easy-to-use, powerful, dynamic program will help you create superior publication-quality professional graphs in minutes! Wow your audience every time they see your graphs.
-
Create clear, concise graphs quickly and easily.
-
Customize every portion of every graph to make the graph completely unique to your situation!
-
Easily create custom graphs using the easy to follow Graph Wizard.
-
Add additional axes, legends, curve fits, annotations, and drawing objects to complete the graph.
-
Communicate your graph to the entire world with full international fonts and character support. Display text such as Chinese, Russian, Greek, Hebrew, or Arabic.
-
Organize your objects in the Object Manager and edit your graphs in the Property Manager!
-
Create templates to use the same graph settings with multiple data files.
-
Save the graphs in Grapher 7, Grapher 8, Grapher 9, Grapher 10, or Grapher 11 GRF or GPJ formats to make sharing documents between colleagues with different versions easier than ever!
-
Automate the graphing process with the included Scripter™.
-
Save time! Use the simple Script Recorder to record your graph making process! Play back scripts to create the graph with a single click!
-
Export graphs for use in presentations and publications in one of Grapher's many export formats, including vector PDF, EMF, EPS, and a wide variety of image formats.
-
Combine multiple axes or plots to display fabulous multiple variable graphs.
Create one of more than 60 unique graph types. Create 2D and 3D line, scatter, class scatter, bubble, function, vector, bar charts, and floating bar charts. Create line, scatter, class scatter, function, vector, bar charts, rose diagrams, and wind rose diagrams in polar plots. Create line, scatter, class scatter, or bubble ternary diagrams. Display data in several specialty graph types, including high-low-close plots, candlestick plots, radar graphs, stiff diagrams, contour maps, and surface maps. Display statistical information with 2D and 3D histograms, pie charts, and doughnut plots, and 2D box-whisker and Q-Q plots.
New Grapher version 7
30/01/2007
 An efficient and powerful graphing program for all of your most complex graphing needs. Ideal for scientists, engineers, and business professionals.
Grapher is an easy to understand technical graphing package for anyone who needs to create publication-quality graphs quickly and easily. With Grapher, creating graphs is quick and easy.
What's New in Grapher 7
New Graph Types
New graph types in Grapher 7 include class scatter plots, polar class scatter plots, 3D XYZ class scatter plots, and stiff plots. The new Class Scatter Plot is a 2D graph that shows your data as scattered symbols on an XY graph. Symbols are set for each "class." Classes are based on a data column in your worksheet.
As with every detail in every graph with Grapher, you can change every portion of your plot to fit your own preferences for eye-catching graphics every time.
Similar to the class scatter plot, the Polar Class Scatter Plot allows you to have different symbols for each class. Easily choose the number of classes and symbols for each class. Alter the polar plot to display any tick mark labels you desire. In addition, you can add other plots to your graph for more detailed information.
Similar to the class scatter plot, the 3D XYZ Class Scatter Plot allows you to have different symbols for each class. 3D XYZ class scatter plots give you an easy way to display four variables on a 3D plot, showing potential trends in data. Easily choose the number of classes and symbols for each class! Save classes to a file to use over and over again with different plots.
Hydrologists have yet another tool to create more of an impact with their data. Stiff Plots can now be created in Grapher 7. Create these informative graphs with striking colors to enhance their display. Add text, labels, and color to make your graph more meaningful. Add background colors to any graph for stunning presentation quality graphics.
Added Script Recorder
Grapher always allows you to create your graphs exactly like you want them. Now, as you create the graphs, use the convenient script recorder to quickly create a script with the steps needed to recreate the graph exactly. The new script recorder and script manager windows are located conveniently directly inside Grapher. Never again spend long amounts of time recreating graphs or laboring over scripting languages. Graphs are efficiently created over and over again with ease.
Create Multiple Symbols on Scatter Plots
Grapher 7 has added the ability to create multiple symbols on a single scatter plot. Choose to either use different symbols for every point from a table, use a worksheet column to specify the symbol, or use repeating symbols from a table. With either the repeating symbols or the varied symbols, you choose the symbol style, color, and size.
Take Control of Bar Chart Widths
Grapher now has the option to create bar charts where the width of the bars can be set. Choose from 3 different methods of setting the width: from a percentage column, in page units, or using the current default width settings.
Combine the width options with existing different coloring options for a truly unique bar chart.
Link Text to a Worksheet Cell
Often you have information in your worksheet that needs to be displayed on your graph. Now, there is a quick and easy way to add text to your graph directly from your worksheet cell. When the worksheet changes, so does the graph.
Change Box-Whisker Outliers
Box-whisker chart outliers are points that are well outside the data median, but still contribute to the definition of the whiskers of the plot. The definition of an outlier is any point that:
falls below the lower quartile – Factor * Inner quartile range
or
above the upper quartile + Factor * Inner quartile range
Grapher 7 now allows you to set the outlier Factor value to any value you want, changing the way the whiskers and outlier points appear on the graph. The default is still 1.5, to mimic previous versions of Grapher.
Add Spline Areas and Curves
Grapher 7 has added new drawing types. Now, in addition to other drawing objects like text, rectangles, ellipses, and points, you can enhance your graphs with spline polylines and spline polygons. Easily edit the points used for the spline objects to quickly change the shape of the line or polygon.
Connect Moved Labels to Points
Labels that have been moved can be difficult to read. Now, you have the ability to link the moved label with a connection line. Easily set line styles.
Convert 2D Graphs to 3D and 3D Graphs to 2D
Grapher now has the ability to convert 2D graphs to 3Dand 3D graphs to 2D. Enhancing the look of your graph has never been so easy. Start with either graph type and use the Graph | Change Plot To command to convert the orientation to the other graph type.
Additional New Features
-
Save time by creating multiple plots from the worksheet in one step. Now, select all of the columns you want and create all of the plots on a graph with one command.
-
Quickly create bar charts from categories using the updated, easier to use Graph Wizard.
-
Add bubbles to your ternary diagrams to show additional information about the graph.
-
Import data directly into Grapher from any ODBC compatible database, including Access, dBase, Paradox, and more.
-
Allow Grapher to automatically back up your files! Save time in power outages by using a backup file to recreate your graph. You choose how often to save the back up files.
-
Create "fill between" graphs where the fill is vertical or horizontal between curves.
-
Store worksheet paths either to a specific folder or to a relative folder name. For instance, if your data is always in a sub-folder of where your graphs are, you can use the relative naming convention to reference this data location.
-
Added box and margin settings to the Text Editor. This allows the fill and line properties to extend a distance away from the text. You set the distance.
-
You choose whether to export page headers and footers with your graph.
-
Change all font sizes, colors, or properties for all entries in a legend at the same time.
-
Link plot names and graph titles to the legend. If the plot or graph name changes, the legend automatically updates.
Grapher Version 6 Released
19/08/2005
Grapher version 6.0 is now available in New Zealand and Australia. With Grapher, creating graphs is quick and easy.
Grapher is an easy to understand technical graphing package for anyone who needs to create publication-quality graphs quickly and easily.
What's New in Grapher
-
New graph types in Grapher 6 include vector plots, contour maps, surface maps, and 3D XYZ floating bar charts.
-
The new Vector Plot is a 2D graph that allows you to show your data as arrows in simple to create formats using an XY starting position and either magnitude and direction or XY ending position. Vectors are drawn using the default arrow and line styles. As with every detail in every graph with Grapher, you can change these styles to fit your own preferences for eye-catching graphics every time.
Grapher 6 has added the ability to create new Contour Maps directly from any data file or from existing Surfer grid files. Grapher gives you the option to colour fill contours.
In addition, you can overlay contour maps on surface maps or other graph types to effectively present your 3D data. The ability to control each contour line and fill colour separately allows you to highlight only the portion of your graph that you choose.
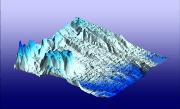
Surface Maps can also be created in Grapher 6. Create these striking, attention-grabbing 3D surfaces from any data file, 3D function, or Surfer grid file. Add 3D line/scatter plots, bar charts, or bubble plots to display your data.
-
Add Confidence Intervals to Fit Curves
-
Create your line/scatter plots with both fit curves and confidence intervals. Select the appropriate confidence interval and Grapher calculates and displays the interval automatically on your graph. Fill between the upper and lower confidence lines to highlight your area of confidence in your fit curve. Add multiple confidence intervals to the same graph.
-
Create Multiple Coloured Bars or Bubbles
-
A popularly requested item by many existing customers has been for Grapher to be able to easily display bar charts or bubble plots with different colours. Now, this ability has been added to Grapher 6. Create a single bar chart graph with any colours for any bars that you choose. In addition to choosing individual colours, you can also fill with any number of gradients, as in the bubble plot at the right.
-
Create Dynamic Header and Footer Labels
-
Easily determine when graphs were last updated by information contained in the header or footer areas. Grapher gives you the option to add file names, dates, and time stamps to graph headers or footers. Change the graph name or alter the graph in any way and the header or footer information will automatically change.
-
Add Gradient Fills to Any Object
-
Any object that supports fill patterns now also supports gradient fill patterns. You can choose to fill areas using one of the many supplied colour files with preset colour gradations, or you can create your own unique custom gradient fills. Choose as many colours as you like and Grapher will create a smooth colour gradation between them. You can save the gradient fill you created to a colour file for later use.
In addition, default features now allow you to have the symbol size set to the plot's symbol size. Now, you have the option to control the default settings.
-
Split Long Axis Labels
-
Long axis labels can be difficult to read. Now, you have the ability to split long axis labels into multiple lines. Easily set a maximum label width for each axis. If a label exceeds this width, Grapher automatically wraps the text to the next line.
In addition, move your radius axis anywhere on the graph. Since data often require moving axes to display the entire data set in a visually appealing manner, you now have the option to choose the best location for your radius axis.
Additional New Features
-
Change default settings. All objects in Grapher 6 have default settings that can be permanently changed by you. Determine the best property for your graphs, such as line style, fill pattern, font size, and set the default to that. Best of all, if you change your mind, you can reset the object back to the Grapher original default setting.
-
Fill your function plot up, down, to the right, or to the left. In addition, you can use gradient fills or include your function plot in the "fill between" graphs.
New Grapher 5 - New Features & Enhancements
03/03/2004
The new Property Inspector in Grapher 5 streamlines the process of making common graph modifications
Grapher version 5 with always available Property Inspector
New in Grapher 5 is a Property Inspector. Editing graphs has never been easier or faster than with the property inspector. No need to double click on your plot to make changes. Now, select the plot, with one click make the change to the graph, and the graph updates immediately! Forget OK buttons and cumbersome dialog boxes. After making the change to one object, select any other object and the Property Inspector updates immediately with the properties for the new object. The helpful property inspector makes editing fast.
Grapher’s new features include:
View the Graph Before you Open It
If you have multiple graph files in the same folder, you already know that it can be difficult to choose which is the correct graph file to open. Now, select any Grapher 5 graph file and click the Preview button. An image of what the file contains will appear making the selection process in choosing the right graph easier than ever.
Custom Toolbars
Grapher 5 gives you the ability to customise any toolbar. Add any Grapher menu command to your toolbar to have the commands you want readily available as quick-click buttons. Buttons can also be removed from any toolbar, giving you the custom look you desire.
Move 3D Graphs Interactively
Quickly and intuitively rotate any 3D graph with the mouse. Simply click and drag the graph to a new orientation.
Moving Plot Labels Just Got Faster
Do the labels in your graph overlap? Grapher 5 has added a more convenient and easy method to move the labels -- with the mouse. Click on any plot label and drag it to a new location. No confusing keyboard keys to press and no need to tab through multiple labels to move the overlapping label.
Lock an Object's Position
Place any object anywhere on the page. Once the object is positioned exactly where you want it to be located, lock the object. The lock prevents the object from accidentally being moved, but still allows you to edit any other properties of the object.
Display Only a Portion of Polar Plots
Grapher 5 has added an enhancement to all polar plots -- the ability to limit the portion of the graph plotted. Now, display only the portion of the graph you desire.
Create 4 New Graph Types
Four new graph types have been added to Grapher. Create new polar bar charts. If you prefer 3D orientations to your graphs, create the new 3D pie chart. Two new 3D XYZ plots have also been added to the program -- 3D XYZ bar charts and 3D XYZ bubble plots. Now, you can have three independent variables for your bar charts and four variables (including the bubble size) for your bubble plots. In addition, all of the previous graph types are still included in the program: 2D line, scatter, step, function, bubble, bar, floating bar, histogram, polar, polar function, rose diagrams, wind charts, pie, ternary diagrams, box and whisker, and hi-low-close graphs and the 3D ribbon/wall, step, function, bar chart, floating bar chart, histogram, and 3D line/scatter plot.
-
Polar Bar Chart Graphs - Polar bar charts are similar to regular bar charts, except that the plot is displayed on polar axes.
-
3D Pie Chart - All pie charts display categories as percentages of a whole. But, by using the 3D pie chart, your graph becomes more aesthetically pleasing and still displays your data accurately.
-
3D XYZ Bar Chart - Display your bar chart data as never before -- with three independent variables. Add additional bar charts to compare multiple categories.
-
3D XYZ Bubble Plot - The same features as a 2D bubble plot are now available in a 3D bubble plot. Only Grapher gives you the ability to compare four variables with this unique graph type.
Fully Customisable Symbols
Grapher 5 adds the ability to change the line and fill color separately for symbols. Make the symbol line color any desired color and the symbol fill color any other color.
Use Picture Fill Patterns
Give your graphs a unique look by filling with any picture. Stretch or tile any bitmap to fill an area.
Change Legend Display Individually
Do your legends require individual settings? Does the number of symbols or the length of the line for your legend differ from plot to plot or on the same graph? Grapher 5 now allows fully customisable legends. Choose to display zero, one, two or three legend symbols. Change the number of symbols or the length of the legend line for each legend separately.
Improved Backwards Compatibility
Need to send a Grapher file to a co-worker who uses Grapher 3 or Grapher 4? No problem. Save the file as a Grapher 3 or Grapher 4 GRF. The file can then be opened, edited, and printed in Grapher 3 or 4. If you don't want to send the data in addition to the graph file, send only a Grapher 4 GPJ. The project file retains all of the data needed to recreate the plot.
Advanced Area Calculations
Calculate the area under your curve to any baseline value. The area tool now shows the area above the baseline, below the baseline, and the total area.
Grapher Supports Numerous Formats
Export in the formats desired by many publications. Create PDF and EPS files directly from Grapher without needing a printer. The EPS and PDF export formats have been added to Grapher 5 to complement the already existing twenty other export formats.
Additional Features
-
Use the Pan command to quickly and easily move the field of view around in the plot window.
-
Add multiple Z axes to 3D graphs to make your graphs more informative.
-
Export spline fit curves to a data file.
-
Customise the frequency of plot labels. Choose the range and the step interval for plot labels.
-
Set the minimum and maximum size of bubbles in a bubble plot to any value. This will allow easier comparison of multiple bubble plots.
-
Use text values as criteria to exclude data. Now, any portion of the data can be excluded with either text or numeric information in your criteria column.
-
Display your Grapher files as tabbed documents.